
As athletes we are in constant pursuit of better performance, what if there was a wearable that gave us a quantitative look into human performance?
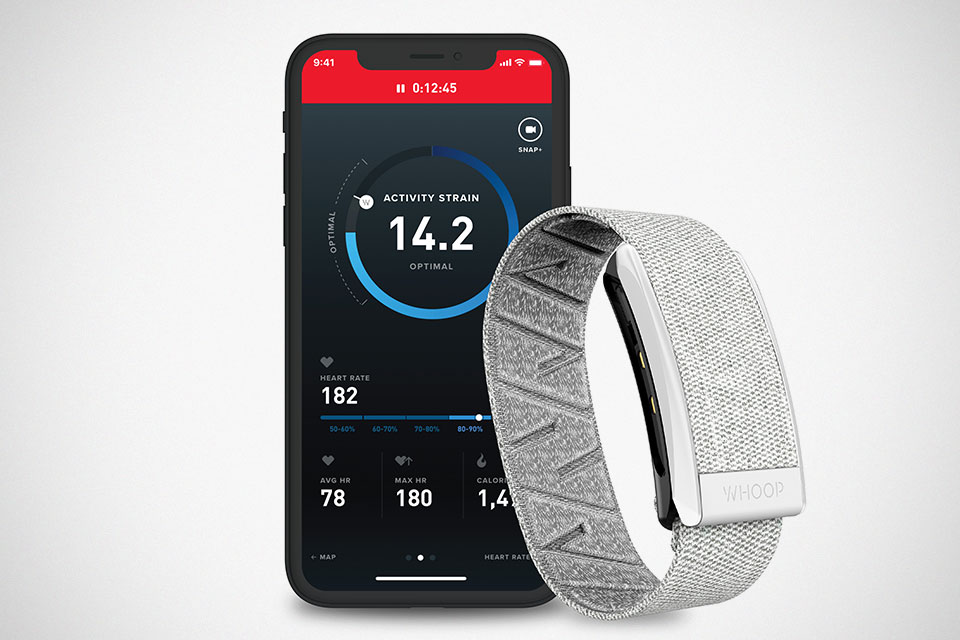
Enter 24/7 performance wearable Whoop Band 3.0
I have been a Whoop user for over a year now, and even though I have hung up the cleats, my love for training and coaching, both on and off the field, has not subsided and has become my passion.
With the baseball development world becoming more and more data driven as time goes on, athletic performance tracking is a neccessity with various streams of workload constantly in flux.
From on field practice and games, increased throwing workload on and off the field, and weight room training protocols on a daily basis; wouldn’t more physiological data only help us gauge athlete workload and recovery?
Let’s get into all of the data that the Whoop Band provides, how it’s broken down, and how it is applicable in the baseball development world.
Strain
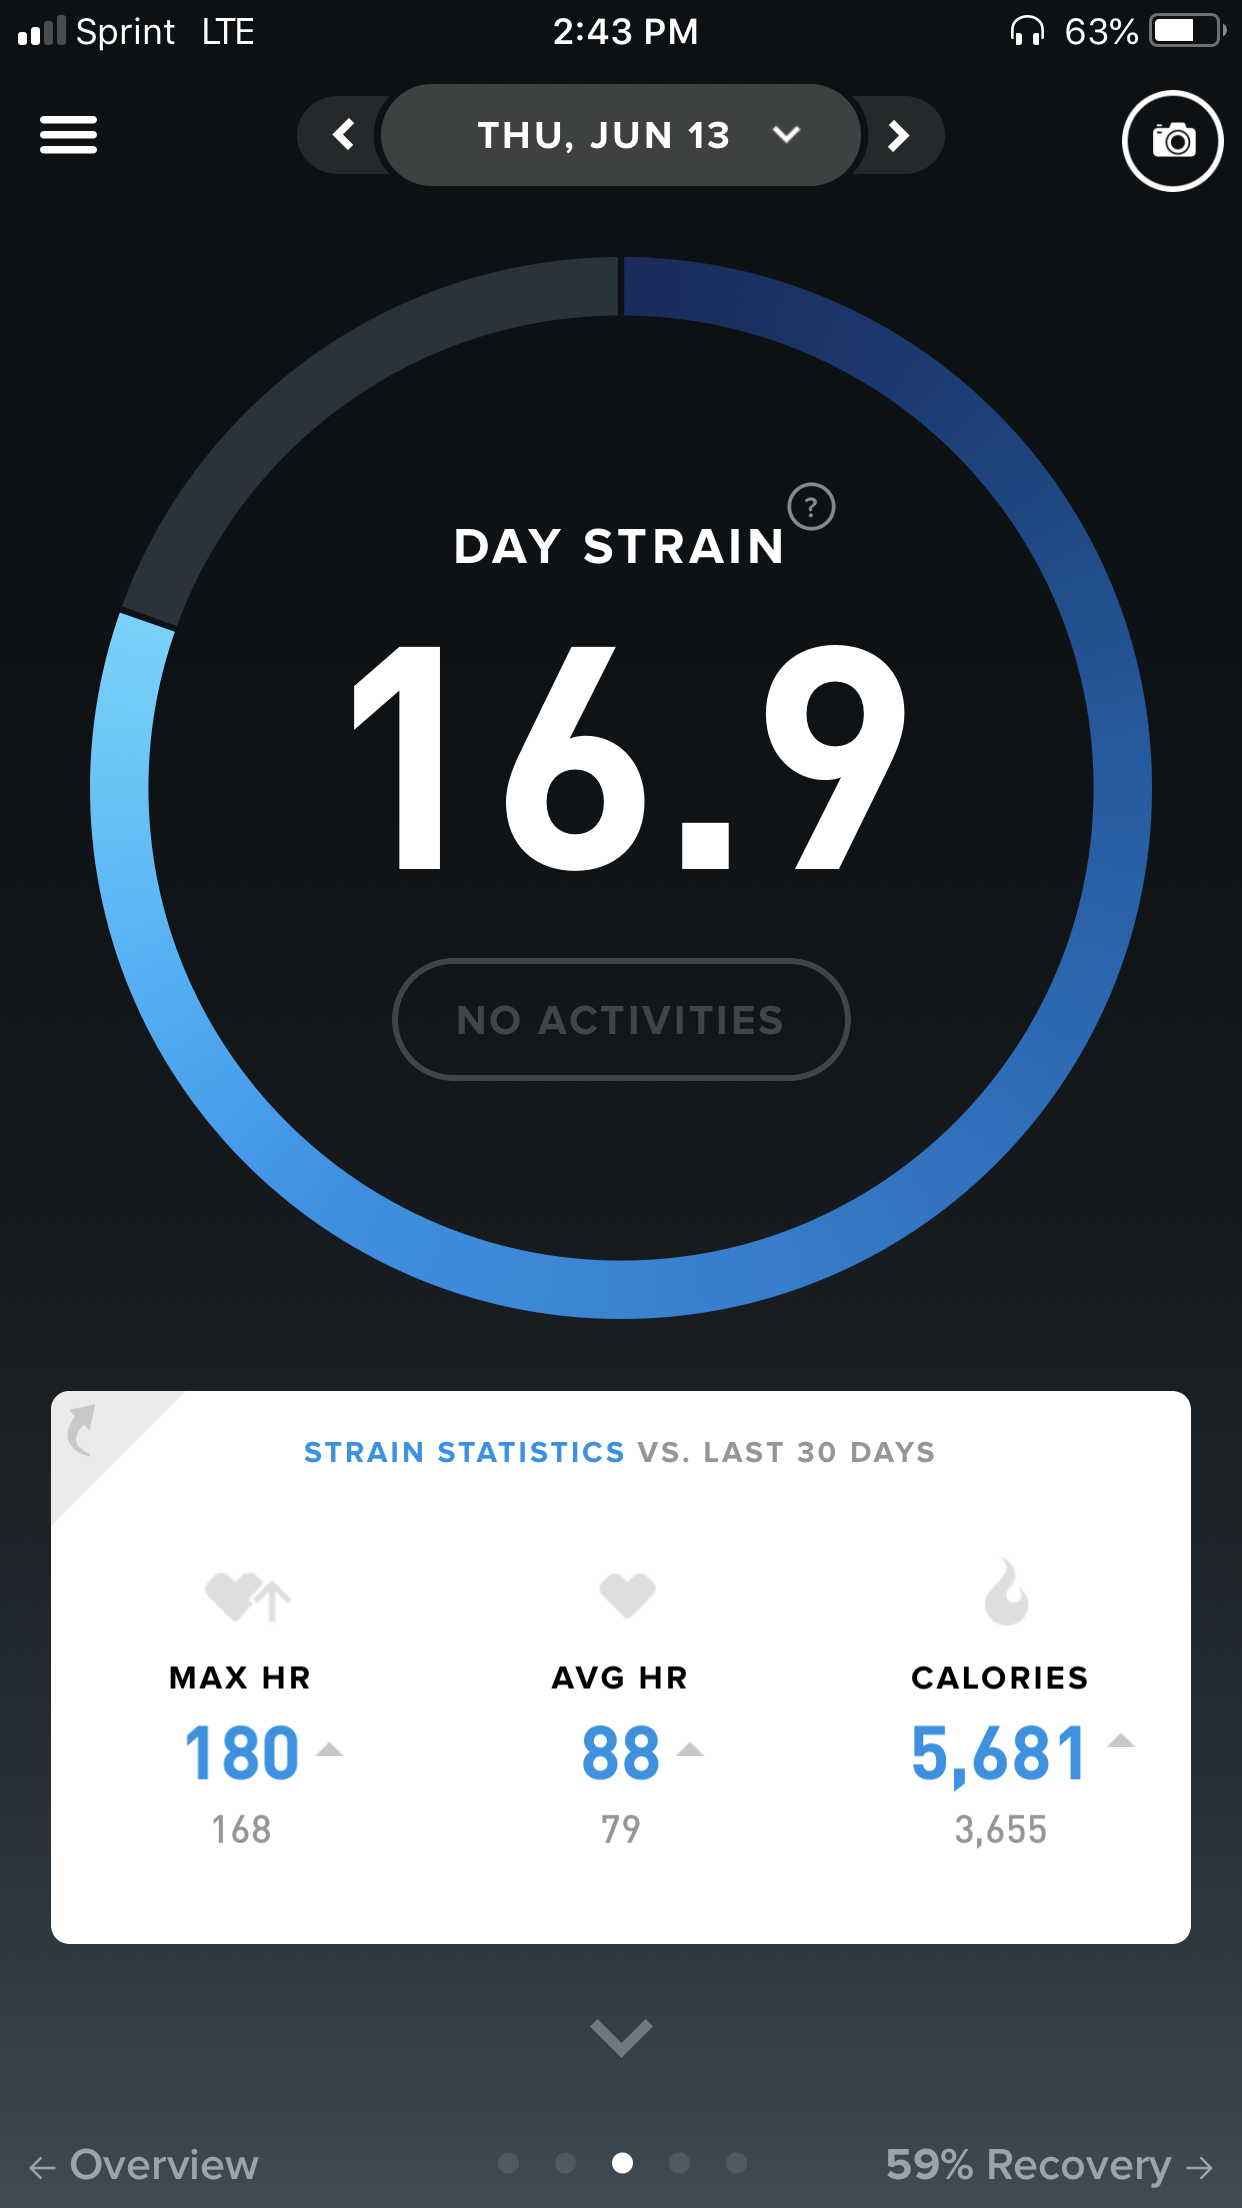
Whoop Strain is a comprehensive measurement of the cardiovascular load your body takes on over the course of the day or specific activity. Strain Score is a quantitative representation of total daily excursion based on cardiovascular load from 0-21 accordingly.
Think of Strain as direct objective feedback on your daily life, from physical workouts to a typical workday, the impact life has on physiological well being.
Through the Strain panel on the Whoop App (IOS/Android), data from Max Heart Rate, Average Heart Rate, and an estimate of Total Calories Burned are displayed. Weekly breakdown of strain averages are also found, dating back to the last 30 days.
- 0-9.9 Light
- 10-13.9 Moderate
- 14-17.9 Strenuous
- 18-21 All Out
During my use of the Whoop Band for about a year now, 17.3 was the highest Strain Score I ever received. Burning almost 6,000 potential calories with an average heart rate of 84 and peaking at 177 BPM.
Recovery
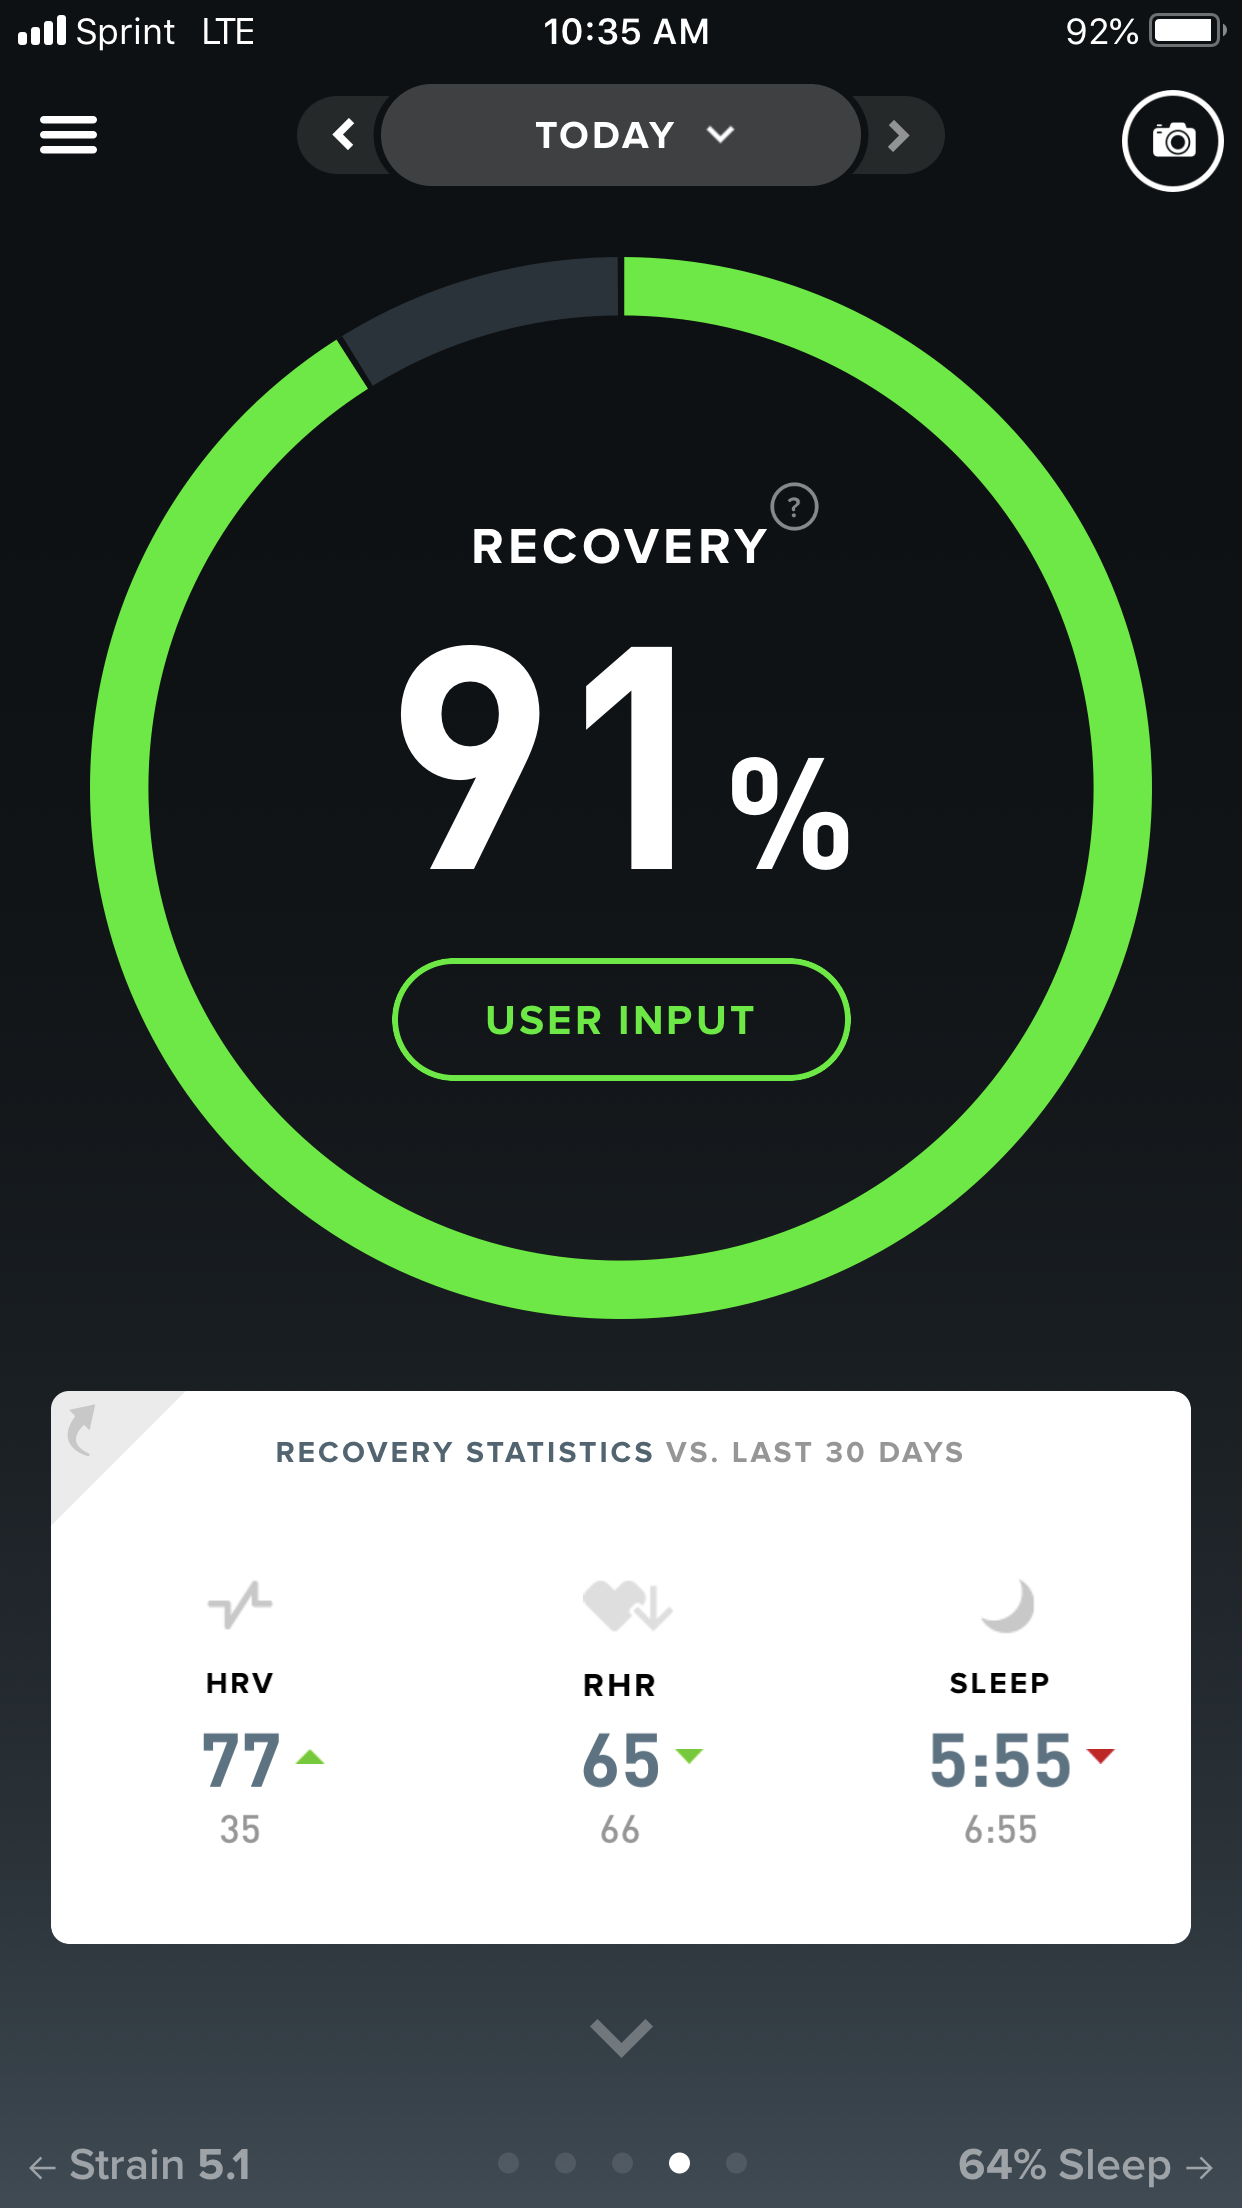
Whoop uses three distinct data values, or physiological markers to determine Recovery Scores: Heart Rate Variability (HRV), Resting Heart Rate (RHR), and Sleep.

The analyzation of the three data measurements is represented by a Recovery Score, measured as a percentage 0-100%.
- Red: 0-33%
- Yellow: 34-66%
- Green: 67-100%
Think of the split between Red, Yellow, and Green as a stoplight of your physiological condition.
With a Red Recovery Score, prioritizing recovery is essential and injury risk is increased. Yellow Recovery Score, gauging overall workload accordingly; Green Recovery Score, primed for peak physical performance.
The Recovery module is the bread and butter of the Whoop Band, an inside look into your physiological condition, giving the athlete the ability to gauge training intensity and duration for any given day, therefore, reducing injury risk and overtraining; taking all the guesswork out of training.
Sleep
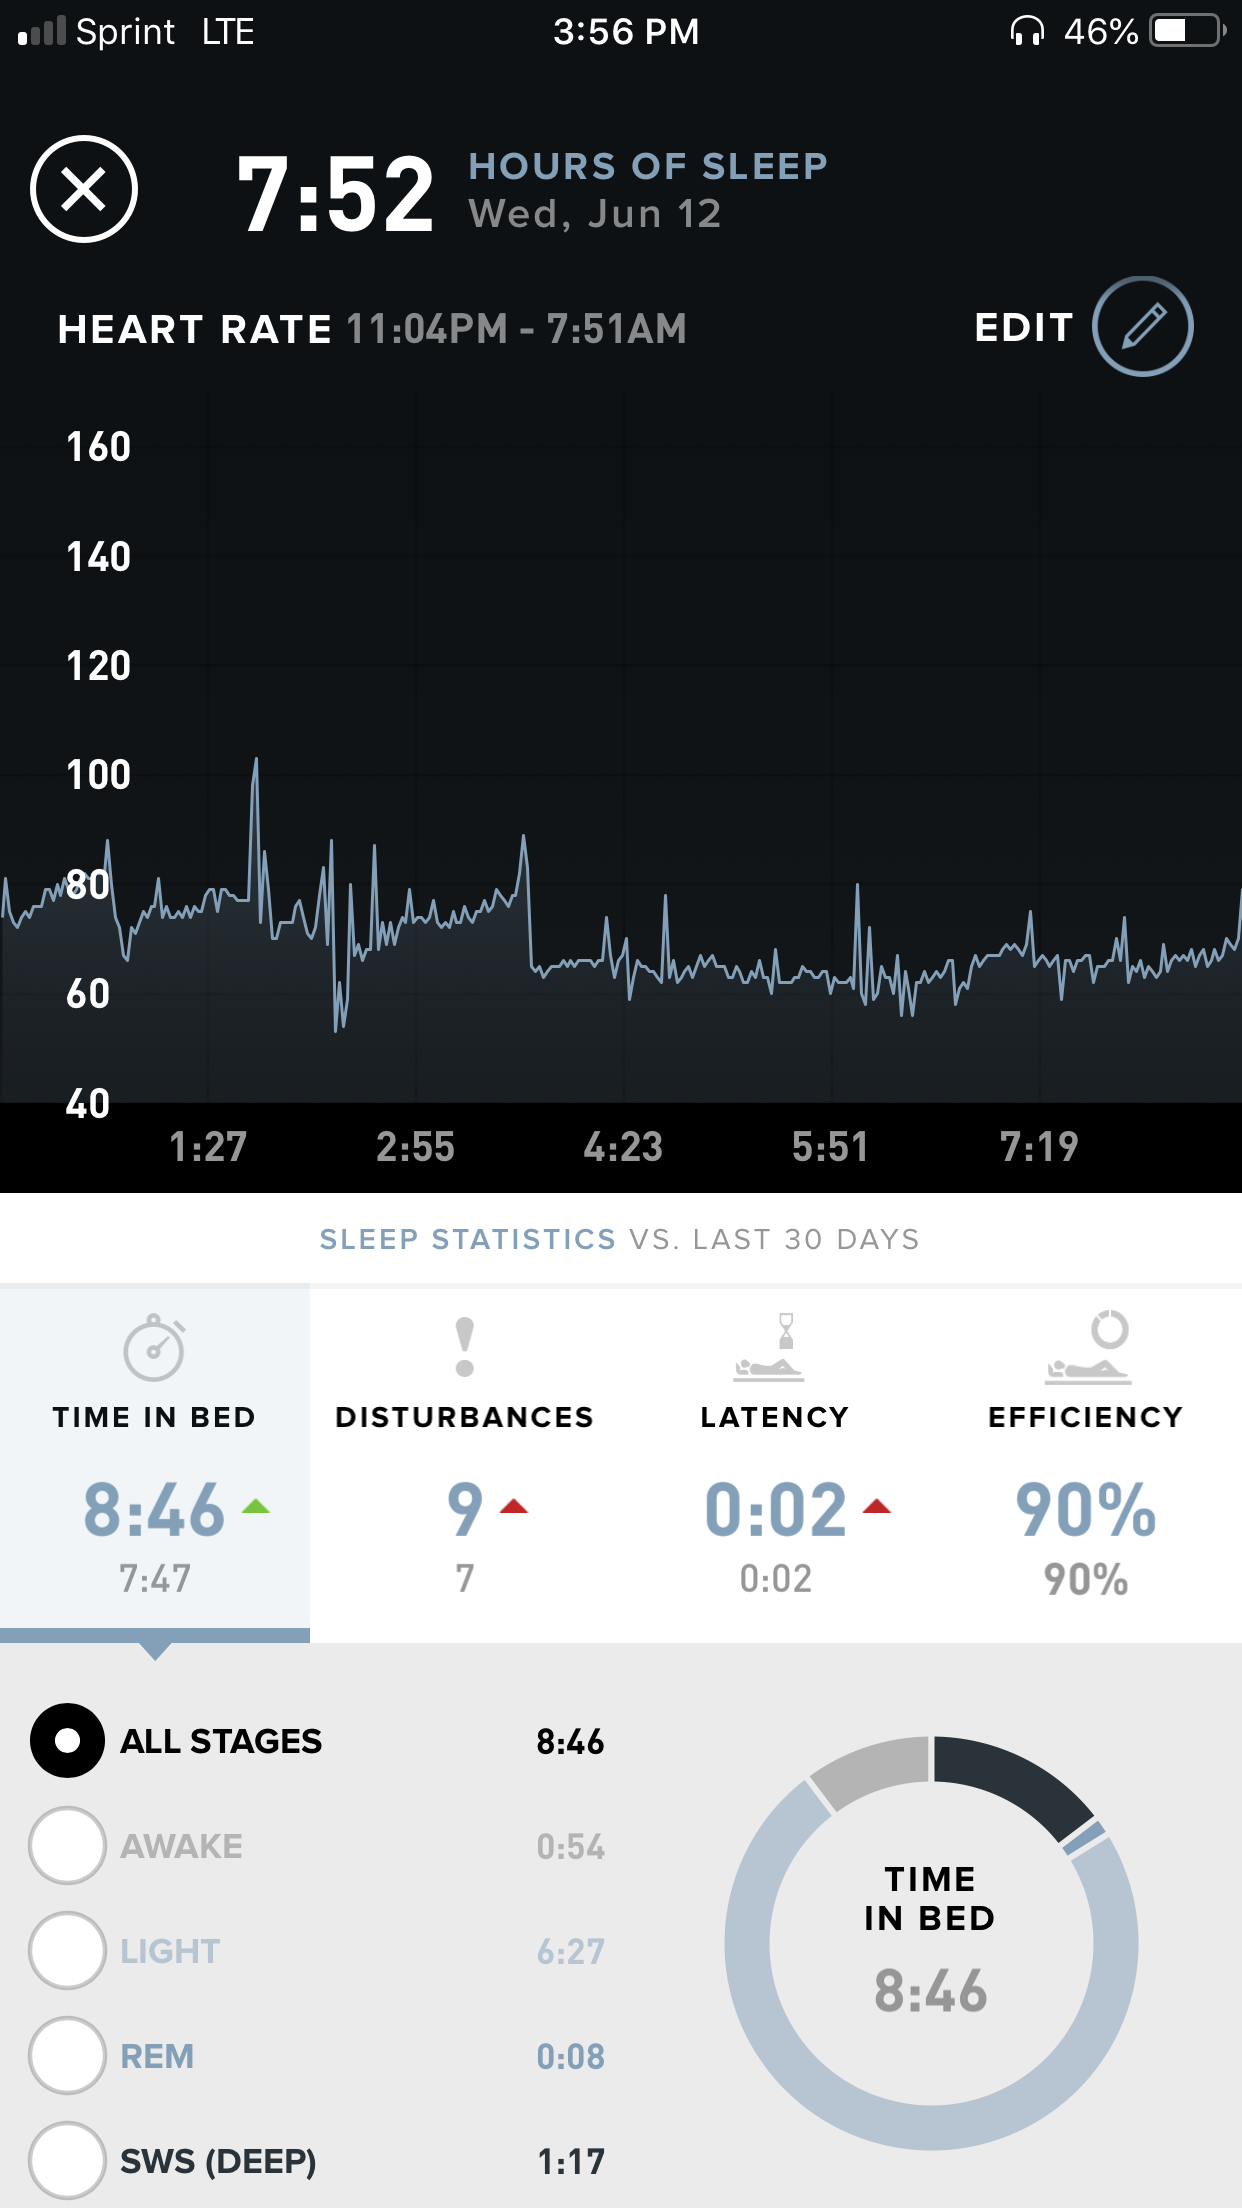
The final module in the Whoop Band data onslaught is Sleep. It’s not a secret that sleep is vital to athletic performance and recovery, I mean 1/3 of our life is devoted to hitting the zzzz’s.
Whoop analyzes and breaks down your sleep pattern into the smallest details, from time spent in each sleep stage (Light, REM, SWS (Deep)), to number of disturbances and heart rate data from the entire sleep cycle.
The Whoop Sleep Coach recommends time in bed and sleep need based on desired performance the following day; whether that be peak, perform, or get by.
Being a 24/7 performance wearable, Whoop is able to determine exact sleep duration and performance in every cycle based on heart rate metrics.
My Experience with Whoop

Approaching one year into Whoop use on a 24/7 basis, let’s just say I will be a user for a long time coming.
In my own training, both throwing and strength work, Whoop has given me the ability to gauge RPE (Rate of Perceived Exertion) of my programming on a daily basis.
One of the most prominent trends I began to see was how hydration impacted recovery scores. Obviously, determining hydration levels are strictly subjective with the judgement of what color your piss is….yet, time and time again, the less hydrated I was to end the day, the recovery score tanked.
Obviously, I decided to do some research, and I found case study after case study that show a direct correlation between dehydration and reduced HRV and increased RHR. Here’s an example in the link below –>
https://www.ncbi.nlm.nih.gov/pubmed/25726222
As far as overall “feel”, more often than not, the recovery score reflected exactly how I felt. Hit a Red Recovery Score of 9%, felt like I got hit by a bus and dragged ass all day long, relying on energy drinks and excess hydration to get me back on the horse.
94% Green Recovery this morning for example, no aches and pains from 22 games in 6+ days, took it easy yesterday in the low 30’s%, saw the benefit of recovery today.
Whoop gave me a new appreciation for prioritizing recovery. With my lifestyle, coaching and training athletes, travel, fighting dehydration, getting my training in, it became clear to me that recovery would often take a back seat; and I wondered by my scores were so low.
Should I be surprised that on May 30th, with a recovery score in the low 20’s, I injured my lower abdominals and lower back during training?
I am by no means a cardiovascular dominant athlete, prioritizing rest periods directly influencing force production is the basis of conjugate based programming both dynamic and maximal effort strength protocols.

Metabolic conditioning in forms of sled work and plyometric movements on boxes are the extent of cardiovascular work that I engage in.
Since I became a Whoop Band user last June, I have seen my HRV peak at 114, typically sitting in the range of low 50s to mid 60s, and tanking in the 30s in full recovery mode.
Also, I have seen my RHR (Resting Heart Rate) get as low as 53-54 BPM, typically sitting 59-63 BPM on an average day and peaking in the upper 60’s when I’m in the tank.

Whoop gives you a subjective look at how sleep impacts your physiological well being, and how essential it is to your athletic performance. More often than not, sleep is low on the priority list of athletes, especially at the college level.
Being primed for peak performance isn’t as simple as preparation for the skill itself, it’s the management of workload and recovery to be at your best on any given day.
Whoop and Baseball Development

Now the real question…how is this technology applicable in the world of baseball development?
From a coach/trainer perspective, with the spectrum of data that the Whoop Band provides, it takes all the guesswork out of managing athlete workload. It gives us the ability as trainers to gauge RPE and total volume based on quantitative data directly from athlete physiological markers.
Prioritizing recovery and off days based on Recovery Score trends, having a better understanding of the Strain each and every athlete accumulates on a daily basis and how they bounce back from the load.
As an athlete, Whoop data points give a greater understanding of how we respond to training stimulus, and what routines hinder and/or improve performance.
The offseason training applications are endless for the Whoop Band, on a one v one basis to an entire training program of athletes. The in season application has more barriers, athletes would need Whoop Arm Sleeves to house the unit, there would be risk of damaging the unit but data collection would be consistent.
Physiological data in both an offseason and in season environment gives coaches and trainers, on and off the field, the ability to reduce injury risk and prime athletes for improved performance, prioritizing recovery and rest periods on an individual and/or team basis.
With baseball development riding the technology and data wave, movement metrics are at a peak, 24/7 physiological data monitoring is the missing key to taking athlete development in our sport to the next level; Whoop is the answer.
“When it comes to recovery, we feel like we have a pretty good advantage in how we treat our players, we leave no stone unturned.”
– Brandon McDaniel, Director of Athletic Development + Performance, LA Dodgers
(LA Dodgers use Whoop Data with athletes all over the system to monitor athlete workload and recovery)
Source Influences:
